A new study led by researchers in the Johns Hopkins Bloomberg School of Public Health Department of Health Policy and Management provides a national estimate of self-reported mental health crises, with pronounced disparities by age, race, and socioeconomic status and circumstances.
As part of the new study, fielded in the spring of 2025, more than 1,900 U.S adults were asked if they had experienced a mental health crisis in the past year. The survey defined crisis as times when one’s thoughts, feelings, or behaviors were too much to handle and required prompt assistance. The new survey is part of the CLIMB study, a nationally-representative, longitudinal study aimed at capturing trends in mental health, financial health, and stressors from 2020 onwards. The paper was published online on August 18, in the journal Health Affairs Scholar.
The survey found that young adults ages 18 to 29 reported the highest crisis prevalence at 15.1%, compared to 2.6% of those over 60. Black (11.8%) and Hispanic (10.5%) adults reported higher rates than white adults (7.4%). Rates were higher among those reporting depression or post-traumatic stress disorder—22.4% in each group—and were highest of all among people who reported experiencing housing instability, at 37.9%.
“These numbers show just how common moments of acute distress are, and how unevenly they’re distributed across the population,” says lead author and assistant professor Andrew Anderson, PhD. Additionally, the study found that people with lower income were more likely to report experiencing a past-year mental health crisis.
“People with fewer assets were more likely to experience mental health crises, highlighting the importance of economic and social factors in addressing upstream mental health,” says assistant professor Catherine Ettman, PhD, senior paper author and leader of the CLIMB Study.
Nearly three-quarters of those in crisis reported seeking some form of help. The most common sources were health care providers (53.2%) and family or friends (39.8%). Fewer than one in five reported using the national 988 Suicide & Crisis Lifeline, and less than 10% reported engaging a mobile crisis team—trained professionals who are dispatched to the individual’s location for immediate, face-to-face intervention and support. For those who did not seek help, common reasons included believing they could handle it themselves, not knowing where to go, or concerns about cost and stigma.
The findings coincide with ongoing efforts to improve the crisis response system in the United States, such as the establishment of Certified Community Behavioral Health Clinics, the extension of mobile crisis teams, and the implementation of 988. The study shows that many crisis-affected individuals avoid these more recent services, opting instead for informal support systems.
The authors note that the gap between the availability of resources and their use by those in crisis may be the result of insufficient knowledge, trust, or accessibility. Respondents’ reliance on health care providers and family or friends also reinforces the ongoing importance of personal networks and primary care in managing mental health crises.
“This isn’t just about adding more crisis hotlines or clinics,” Anderson says. “It’s about making sure the services we already have are visible, trusted, and connected to the support systems people turn to first—their doctors, their families, and their communities.”
The authors advocate for targeted outreach to groups with the highest burden of crisis, including younger adults, those with low incomes, and individuals experiencing housing instability, while continuing to integrate formal crisis services with community-based and informal supports.
“Mental Health Crises and Help-Seeking Among U.S. Adults in 2024 – 2025” was co-authored by Matthew Eisenberg, PhD, Alene Kennedy-Hendricks, PhD, Brian C. Castrucci, DrPH, Sandro Galea, MD, DrPH and Catherine K. Ettman, PhD. Funding was provided by the Johns Hopkins Center for Mental Health and Addiction Policy, the Johns Hopkins Center for Health Disparities and the de Beaumont Foundation.
Leading with the 5 Cs: How Today’s Executives Can Champion Mental Health
We’re currently in an era where workplace mental health issues are paramount – and in response, executives must lead with empathy, strategy, and resilience. It can be tricky to know where to begin, but The 5 Cs of mental health – Competence, Confidence, Connection, Character, and Caring, offer up a comprehensive framework for creating an optimally supportive work environment.
Mental health issues can be multi-layered, so when it comes to tackling them, it helps to have a good strategy in place. This article will lay out how leaders can effectively integrate these principles, so they are able to enhance employee wellbeing for the entire organisation’s benefit.
What are the 5 Cs of Mental Health?
The 5 Cs provide a holistic framework for approaching mental health, placing the emphasis on personal development and interpersonal relationships:
Competence – Feeling capable of coping with life’s challenges and achieving set goals.
Confidence- Believing in one’s abilities and sustaining a positive self-image.
Connection – Creating and maintaining supportive relationships with others, nurturing a sense of belonging and community.
Character – Showing integrity, ethical behavior, and a sense of responsibility.
Caring – Demonstrating empathy and concern for self and for others.
Integrating these Cs organically into the entire workplace culture will significantly boost employee mental health, as well as organisational performance.
The Business Case for Mental Health
Workplace mental health is more than a moral imperative, it’s also a financial issue. According to research from Reuters, organisations looking to cut waste and boost productivity, should consider the following statistics, which underscore the importance of embedding proactive mental health strategies in the workplace.
Mental health issues currently account for around 12.7% of all sickness absences in the UK workforce.
Work-related stress, anxiety, or depression accounted for 49% of all new or long-standing health conditions in 2022/23.
The cost of poor mental health to UK employers is estimated at £56 billion per year.
For every £1 invested in mental health interventions, employers see a return of £5 in reduced absenteeism.
Implementing the 5 Cs in the Workplace
1. Competence
Offer Training and Development – ensure employees can upskill by providing adequate opportunities to enhance their abilities and knowledge. This will boost their confidence when it comes to handling the responsibilities of their roles.
Clearly Outline Expectations – Make sure roles and responsibilities are sharply defined, reducing any ambiguity and stress.
Provide Resources – Properly equip employees with the tools and support they will need to succeed, empowering a sense of competence.
2. Confidence
Encourage Transparent Dialogue – Cultivate an environment where there is open communication so employees feel safe to express their thoughts and concerns.
Recognise Employee Achievements – Acknowledge and celebrate both individual and team successes to build a sense of value and pride and encourage self-esteem.
Offer Constructive Feedback – Give regular, tailored feedback that is supportive and aimed at developing employee’s personal growth.
3. Connection
Promote Team Building – Organise and host activities that strengthen community and encourage colleague interpersonal relationships.
Nurture Inclusivity – Ensure every employee feels valued and included, regardless of their background or role.
Support Healthy Work-Life Balance – Encourage practices that allow employees to balance their professional and personal responsibilities.
4. Character
Lead by Example – Demonstrate integrity and ethical behavior in all actions.
Promote Accountability – Encourage all employees to take responsibility for their actions and decisions.
Uphold Organisational Values – Make sure company policies and practices always align with core stated ethical principles.
5. Caring
Provide Adequate Mental Health Resources – All workers should have access to counseling services, employee assistance programs, and wellness initiatives.
Encourage Empathy – Train managers to spot the signs of stress and mental health issues and equip them with the skills they need to be able to respond with compassion.
Create a Supportive Environment – Foster a workplace culture where mental health is prioritised and any taboo around the subject is reduced.
The Role of Leadership
Leaders play a pivotal role in shaping the workplace culture and influencing their employee’s wellbeing. If they effectively embody the 5 Cs, leaders will be able to:
Set the Correct Tone – Establishing a culture that values mental health and wellbeing.
Provide Proper Support – Offering guidance and resources to employees facing any mental health challenges.
Encourage Open Conversation – Nurturing an environment where employees feel safe discussing their mental health issues – without any fear of judgment.
Investment in mental health is well worth it for organisations, as effective leadership in this area not only improves employee wellbeing, it encourages peak organisational productivity and performance.
5 C’s of Success
Embedding the 5 Cs of mental health and and the 5 C’s of employee engagement across workplace practices is key to creating a supportive, productive environment. By focusing on these core principles; Competence, Confidence, Connection, Character, and Caring, executives will lead their organisations toward boosted employee wellbeing and improved organisational success.
Investing in mental health is not just beneficial for employees – it’s crucial for the company’s bottom line. As the workplace continues to evolve, placing mental health as a priority will be pivotal to its success and to sustaining a healthy, engaged, high-performing workforce.
David Brooks is one of our most eloquent social commentators. He has written this last OpEd for the New York Times which gives us his opinion about the culture in which we are serving and what we might do to be part of the renewal. Here are some excerpts- click the link to the article which is quite long.
……We have become a sadder, meaner and more pessimistic country. One recent historical study of American newspapers finds that public discourse is more negative now than at any other time since the 1850s. Large majorities say our country is in decline, that experts are not to be trusted, that elites don’t care about regular people. Only 13 percent of young adults believe America is heading in the right direction. Sixty-nine percent of Americans say they do not believe in the American dream……..
We’re abandoning our humanistic core. The elements of our civilization that lift the spirit, nurture empathy and orient the soul now play a diminished role in national life: religious devotion, theology, literature, art, history, philosophy. Many educators decided that because Western powers spawned colonialism — and they did — students in the West should learn nothing about the lineage of their civilization and should thereby be rendered cultural orphans. Activists decided persuasion is a myth and that life is a ruthless power competition between oppressors and oppressed groups. As a result of technological progress and humanistic decay, life has become objectively better but subjectively worse. We have widened personal freedom but utterly failed to help people answer the question of what that freedom is for.
The most grievous cultural wound has been the loss of a shared moral order. We told multiple generations to come up with their own individual values. This privatization of morality burdened people with a task they could not possibly do, leaving them morally inarticulate and unformed. It created a naked public square where there was no broad agreement about what was true, beautiful and good. Without shared standards of right and wrong, it’s impossible to settle disputes; it’s impossible to maintain social cohesion and trust. Every healthy society rests on some shared conception of the sacred — sacred heroes, sacred texts, sacred ideals — and when that goes away, anxiety, atomization and a slow descent toward barbarism are the natural results.
It shouldn’t surprise us that, according to one Harvard survey, 58 percent of college students say they experienced no sense of “purpose or meaning” in their life in the month before being polled. It shouldn’t surprise us that people are so distrusting and demoralized. I’m haunted by an observation that Albert Camus made about his continent 75 years ago: The men of Europe “no longer believe in the things that exist in the world and in living man; the secret of Europe is that it no longer loves life.”
We could use better political leadership, of course, but the crucial question facing America is: How can we reverse this pervasive loss of faith in one another, in our future and in our shared ideals? I do not believe that most people can flourish in a meaningless, nihilistic universe. Despite what the cynics say, I still believe we’re driven not only by the selfish motivations but also by the moral ones — the desire to pursue some good, the desire to cooperate, to care for one another and to belong. Life is about movement, and the flourishing life is the same eternal thing, some man or woman striving and struggling in service to some ideal…..
Edmund Burke argued that culture, which he called “manners,” is more important than politics. Manners, he wrote, “are of more importance than laws. Upon them, in a great measure, the laws depend. The law touches us but here and there, and now and then. Manners are what vex or soothe, corrupt or purify, exalt or debase, barbarize or refine us, by a constant, steady, uniform, insensible operation, like that of the air we breathe in. They give their whole form and color to our lives. According to their quality, they aid morals, they supply them, or they totally destroy them.”
The good news is that culture changes all the time as people adjust to meet the crises of their moment. In the 1890s, the Social Gospel movement, with its communal emphasis, displaced the social Darwinist culture, with its individualistic, survival-of-the-fittest emphasis. That cultural shift eventually led to political change: the Progressive era. American culture also shifted radically between 1955 and 1975, producing a culture that was less conformist, less sexist and racist, more creative than the one that came before, though also one that was more atomized. The culture war that began in that era produced both the modern left and the modern right. American culture today is already vastly different from how it was during the Great Awokening of 2020.
We Americans went through hard times before, and we have always recovered through a process of cultural rupture and repair. Some old set of values and practices has to be torn away and some new ones embraced.
If America could once again restore its secure emotional, material and spiritual base, maybe we could recover a smidgen of our earlier audacity. Oscar Wilde joked that youth is America’s oldest tradition. Maybe it’s time the country matured, and combined youthful energy with the kind of humility and wisdom that Reinhold Niebuhr packed into one of his most famous passages:
Nothing that is worth doing can be achieved in our lifetime; therefore we must be saved by hope. Nothing which is true or beautiful or good makes complete sense in any immediate context of history; therefore we must be saved by faith. Nothing we do, however virtuous, can be accomplished alone; therefore we are saved by love. No virtuous act is quite as virtuous from the standpoint of our friend or foe as it is from our standpoint. Therefore we must be saved by the final form of love, which is forgiveness.
Martin Luther King Day is upon us for another year. “I have a dream” will be revisited like a sacred text. What a lot of people forget is that this was not part of the original speech. It was a happy accident of encoragement and inspiration.
Mahalia Jackson, the great singer, noticing the restless crowd, whispered to King,“Tell them about the dream, Martin.” From a speech of advocacy for rights, it becomes a sermon. No longer reading from a text, his head is up reading the heavens and the crowd.
Four years later, he would want to take it all back. Say the dream had turned into a nightmare. The next year, that nightmare would consume him.
We want to remember the dream, like one shining moment in the darkness. Perhaps we need that now, more than ever.
MLK day reminds us of one special speech, one that swells into a cadence about dreams. If King were to re-enact it for 2026, how would it end? It would still only be a dream.
We forget how the event was never about dreams. It was about demands. It began with condemnation, accusation, and indictment. Life and Liberty were not dreams, King said. They were the solemn pledge of the Republic. A check the founders signed and promised to pay. In 1963, African Americans found the bank of freedom had run out of funds.
The March on Washington was meant to be practical, political, organized to pressure power. For a while it did. But somehow, memory has dropped the demand for a dream. Demands call for action. Dreams need sleep.
The March on Washington was never about a dream. It was about a demand, one still not heard.
Nowadays, mental health is not a topic that can be ignored. Stress, anxiety, and emotional exhaustion are part of young people’s lives, with almost 60% of teenagers experiencing mental health challenges. In this article, you can look at the latest statistics on student mental health in 2026. What should you expect, and how can you help your kid? As a teacher, it’s important for me to share this.
Key Points
About 14-15% of teenagers worldwide have a diagnosed mental health disorder. Nearly half report intrusive anxious thoughts or stress.
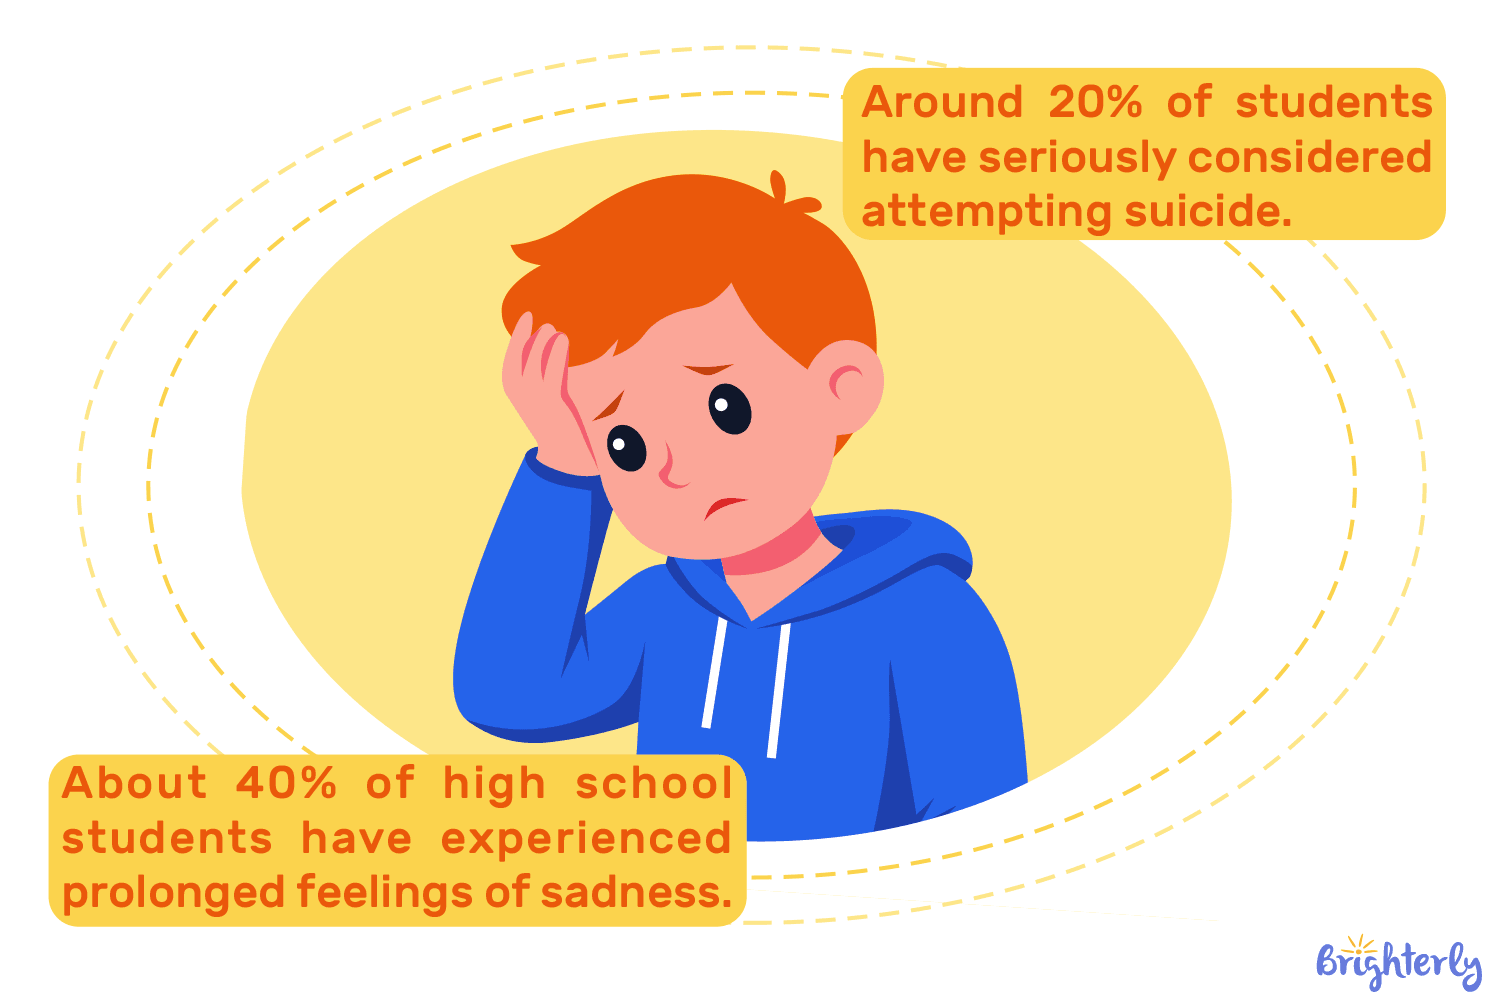
In the United States, about 40% of high school students have experienced prolonged feelings of sadness or hopelessness, and roughly 20% have seriously considered attempting suicide.
What are the mental students health issues? Due to the World Health Organization, the most common issues are anxiety (9.4%), depression (4.7%), and behavioral disorders (4.9%).
Student mental health statistics worldwide
I will start with general statistics. According to the World Health Organization, about one in seven teenagers aged 10 to 19 has a mental health disorder. I talk about a clinically diagnosed condition. That equals roughly 166 million children worldwide.
These disorders vary. Some teenagers struggle with obsessive and compulsive behaviors, which can be symptoms of a mental health illness like anxiety or depression, eating disorders, and other behavioral conditions. To make things easier to understand, I created a table that shows what percentage of children experience each of them:
To make this clearer, these are the common student mental health issues:
Condition
Age
Prevalence
Short description
Anxiety disorders
10–14
4,1%
The most common emotional disorders among younger teens. They include panic and excessive worry.
15–19
5,3%
Learning and social interaction
ADHD (behavioral disorder)
10–14
2,7%
Attention difficulties, hyperactivity, and impulsive behavior. More common in younger teens.
15–19
2,2%
Lower prevalence with age
Depression
10–14
1,3%
Main symptoms include low mood, loss of interest, fatigue, and changes in appetite and sleep.
Why is student mental health important? Some of these disorders, such as depression, can seriously affect a child’s school performance, future work life, social connections, and overall interest in life if adults ignore them. Sadly, today, suicide stands as the third leading cause of death among young people, and mental health disorders are often linked to this risk.
What percentage of students struggle with mental health around the globe?
The global statistics on how many teens struggle with mental health are difficult to measure precisely. These numbers remain approximate because not all countries run regular studies or surveys. Different assessment methods and cultural factors also shape the results. Even in countries that do collect data, researchers do not run mental health assessments every year. So I want to stress this clearly: the data below shows only a general picture, not exact numbers.
Here are the teen mental health statistics I found:
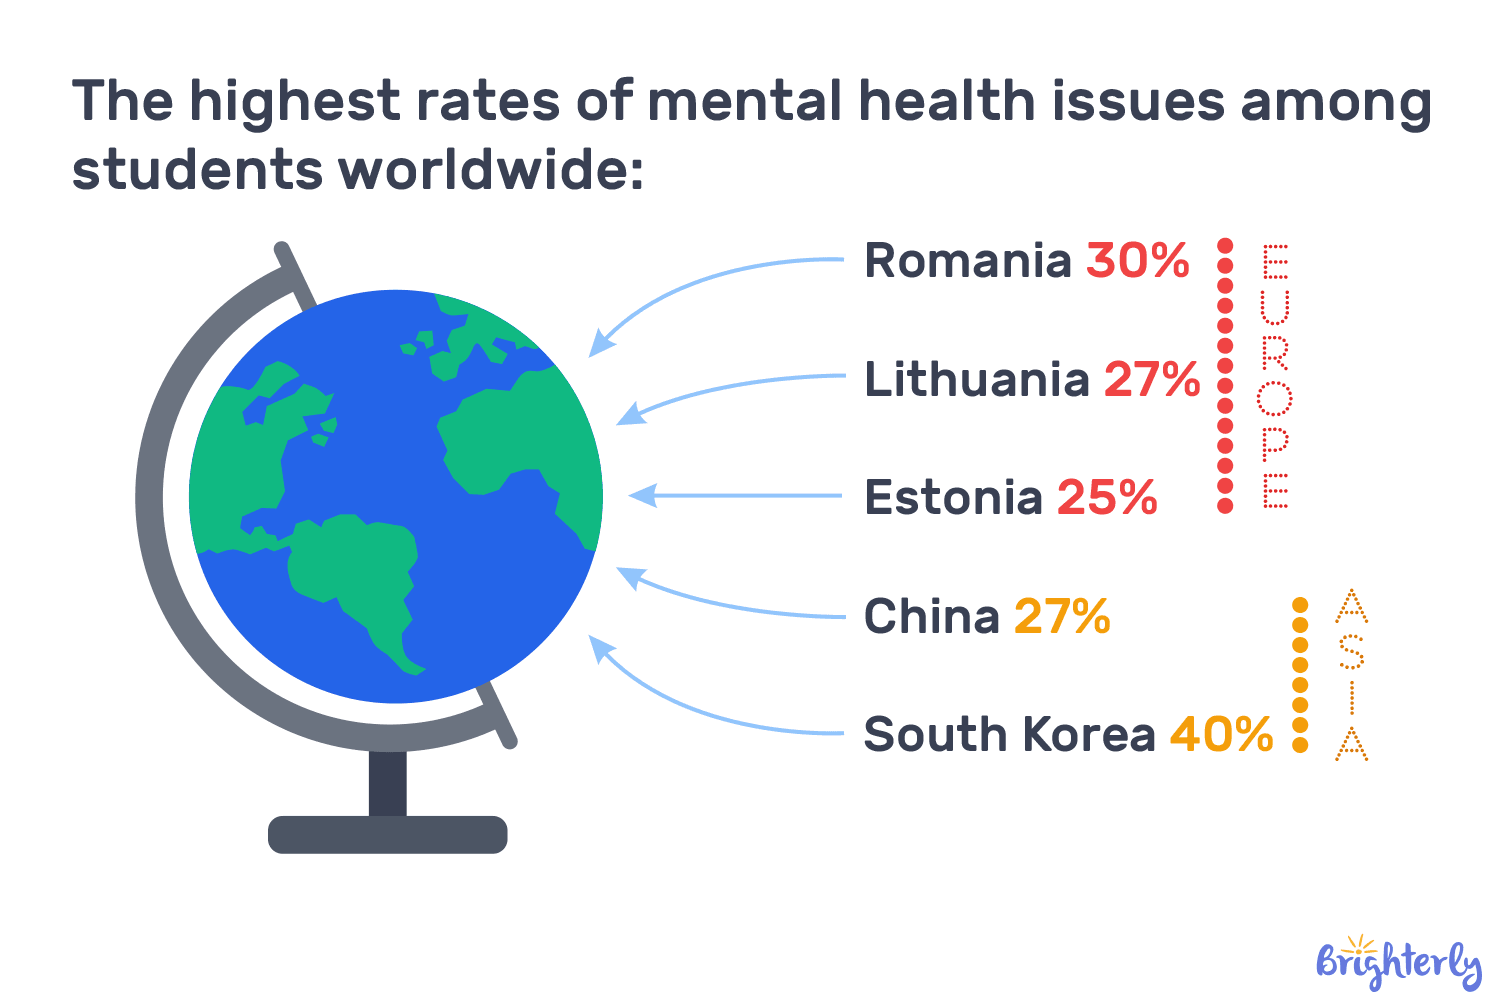
In Europe, international surveys by Frontiersin show that, on average, about 20% of children report anxiety, depression, or emotional difficulties. The highest numbers appear in countries such as Estonia, Lithuania, and Romania, where 25–30% of children report these issues.
At the same time, Scandinavian countries like Iceland, Norway, and Finland show the lowest rates. In these states, only about 12–14% of students report increased anxiety. I believe these countries often have lower stress levels and stronger social support systems.
When I talk about Asia, China and South Korea stand out among the countries with the highest stress levels. Surveys show that 12–27% of school students in China report psychological stress. In South Korea, stress levels among teenagers reach almost 40%. This data refers to school-aged students.
For college and university students, global data shows that about one in four experience symptoms of both depression and anxiety at the same time. Around 12% face the risk of severe depression.
What are student mental health statistics in the US?
According to the Centers for Disease Control and Prevention (CDC), about 40% of high school American students have experienced prolonged feelings of sadness or hopelessness. Nearly 30% said their mental health felt “poor” during a certain period of time. In the same survey, around 20% reported suicidal ideation, and about 9–10% actually attempted suicide within one year.
Another CDC dataset shows similar mental health in teens statistics. About 29% of high school students reported that their mental health felt “poor” most of the time or all the time during the past 30 days prior to the research.
There is also data on college and university students. According to the Healthy Minds Study 2024–25, about 37% of students sought therapy or counseling during the past year. Many respondents also reported symptoms of depression and anxiety.
How can online schools/tutors support student mental health?
To support student mental health, students and tutors can create a supportive learning environment where a child can learn without constant pressure. If this doesn’t work, I recommend considering individual learning.
Mental health challenges need addressing because they are often linked to conflicts with classmates or teachers, as well as pressure around grades and academic performance. All of this can become a serious source of stress for a child. So, how to improve student mental health?
I believe platforms like Brighterly can help here. It is an online program that supports children with reading and math. Beyond academics, it offers a personalized approach. Teachers adjust lessons to each student’s level and pace, moving forward step by step. The mentors are professionals, but they also build warm, trusting connections with children and support them throughout the learning journey.
The lessons are interactive as well. You can read more about how effective this approach is in the article Interactive learning statistics.
With Brighterly, you also have a chance to download free math and reading worksheets — they are quite convenient for interactive practice at home.
Brighterly teachers adapt the program to each student and create a calm environment.Try NOW!
What are the student stress statistics by state?
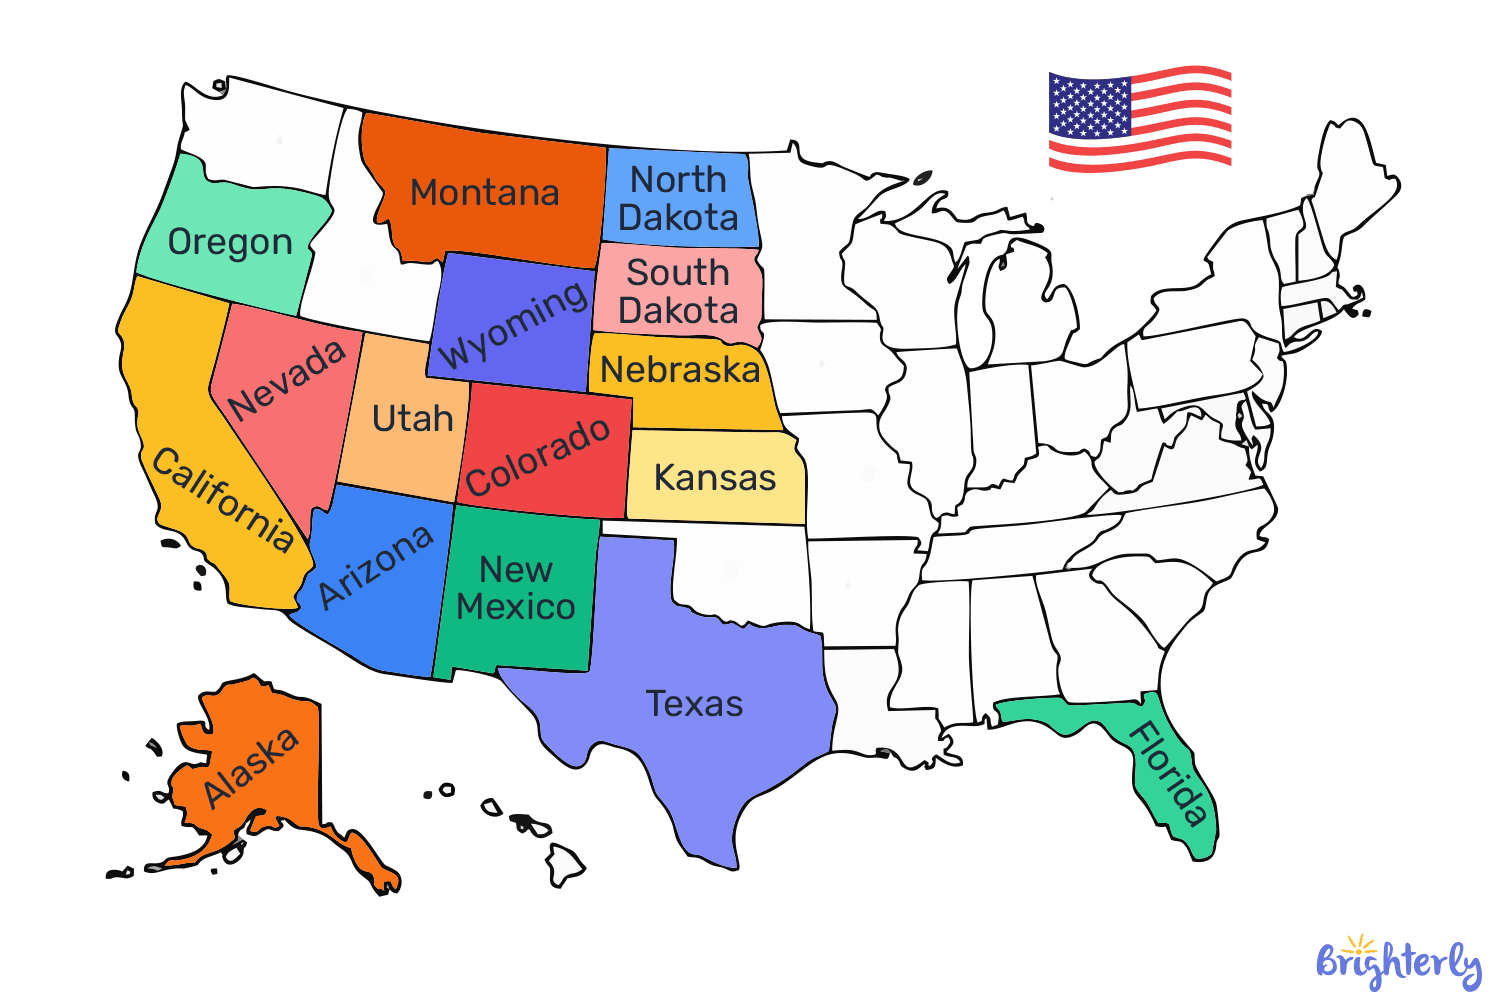
The Mental Health America map clearly shows how many school students aged 12–17 experienced at least one major depressive episode in the past year. According to the map, the states with the highest rates are Maryland, Nevada, and Colorado, ranging from 21.9% to 22.6%.
On the other hand, the states with the lowest rates are Alaska (17.27%), California, Indiana, New York, and Washington. In all of these states, student stress levels have dropped by 5% or more in recent years.
Student mental health statistics infographic
To help you quickly understand what are the statistics for stress in students across the US, here’s a chart. A quick guide: the lighter the state, the lower the prevalence of mental health issues and the better access to care for youth. The darker the state, the more challenging the situation.
Students mental health statistics by year
Student mental health statistics 2020
Even before the COVID‑19 pandemic, researchers began noticing increasing stress among children aged 10–14. According to YRBS data, depressive symptoms among teenagers have been gradually rising since the 2010s.
By early 2020, UNICEF observed that one in seven teenagers worldwide had a mental health disorder. That is roughly 89 million boys and 77 million girls.
What influenced this year? Social media and the start of the pandemic (stress from uncertainty).
Student mental health statistics 2021
In 2021, CDC YRBS reported that 42% of high school students experienced persistent sadness or hopelessness. About 29% said their mental health was poor during the previous 30 days.
What influenced this? Strict COVID‑19 lockdowns, remote learning, social isolation, and the broader crisis. Find more about the pandemic’s impact in the article Pandemic Learning Loss Statistics.
Student mental health statistics 2022
After 2021, there was a gradual decline, but stress remained high. About 21% of teenagers experienced anxiety symptoms, and around 17% had depression (CDC/Teen NHIS).
In many places, schools began reopening in person, which partly reduced isolation.
What influenced this? Mental health in schools statistics showed improved trends due to the decrease in social isolation.
Student mental health statistics 2023
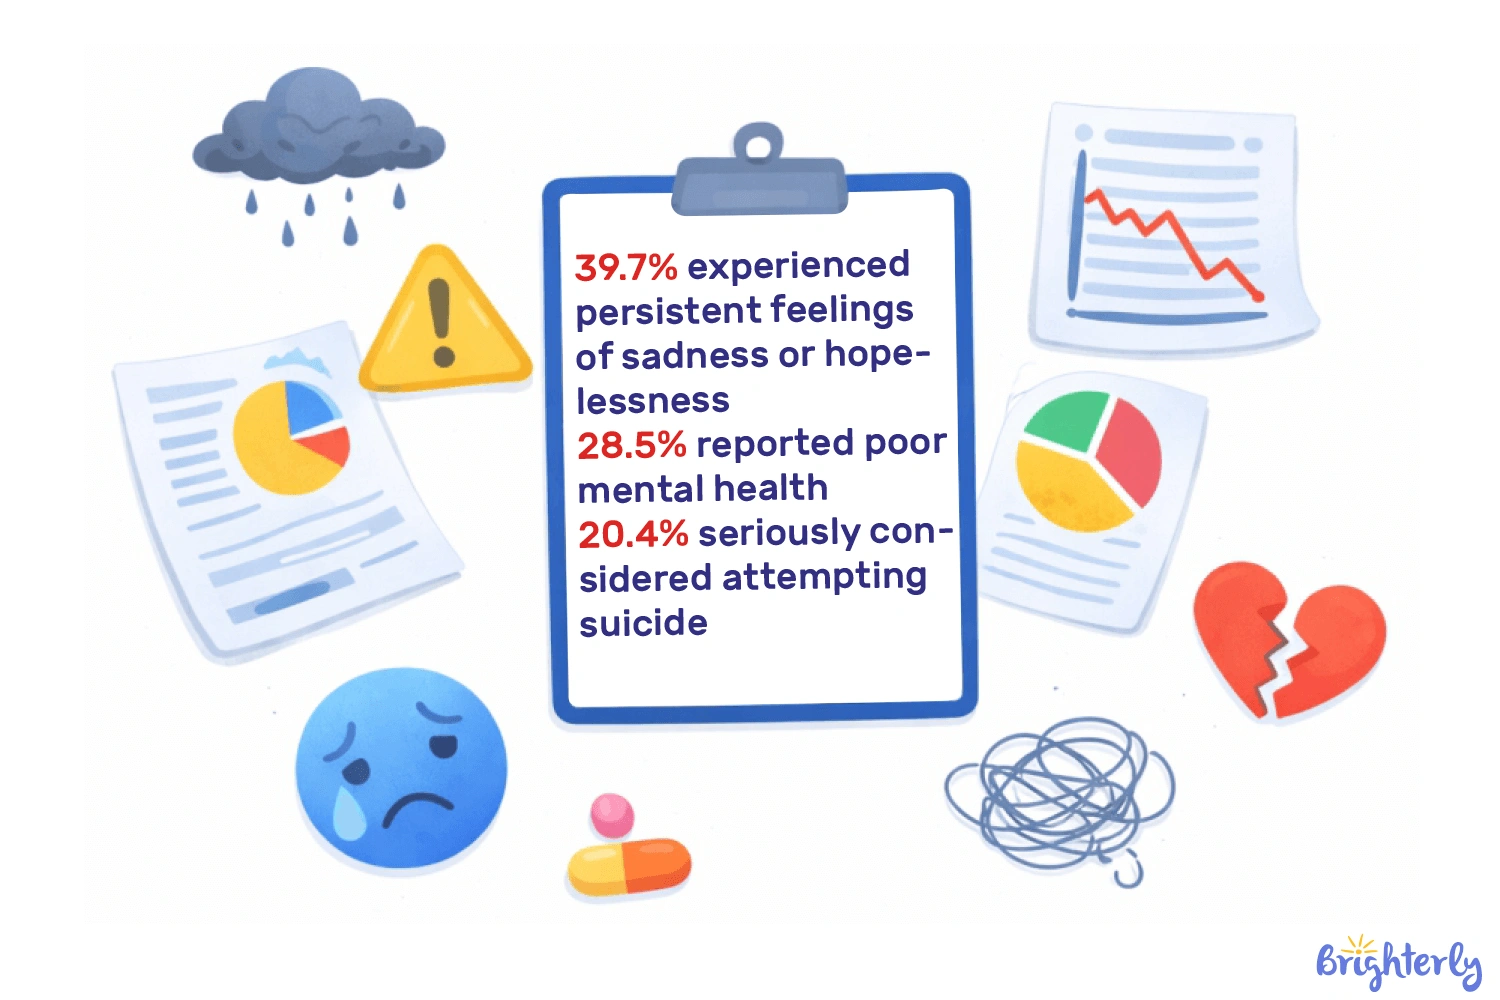
CDC survey data from 2023 show high levels of psychological distress among U.S. high school students:
39.7% experienced persistent feelings of sadness or hopelessness
28.5% reported poor mental health
20.4% seriously considered attempting suicide
This data remained pretty much the same, as per the student mental health statistics 2024.
What influenced this? Returning to in-person school after the pandemic, social factors such as social media, academic exams, economic and future uncertainty, and media coverage of the war.
Student mental health statistics 2026
Globally, according to the WHO 2026 Fact Sheet, about one in seven (~14%) teenagers has a mental health disorder (anxiety, depression, etc.).
There is a trend toward returning to pre-pandemic levels, but rates remain higher than before.
What influenced this year? Long-term effects of social isolation and the digital environment on youth, along with broader access to information about mental health.
Which country has the most stressed students?
New Zealand ranks lowest in terms of mental well-being among children and teenagers as according to the international child well-being ranking by UNICEF. Close behind are Japan and South Korea. In Ireland, 1 in 15 teenagers reports low life satisfaction.
IMPORTANT! This ranking only considered 43 of the wealthiest countries (out of 195 possible). Even among these, not all countries conducted the same studies, so the data vary. These numbers should be seen only as a general overview, not exact figures.
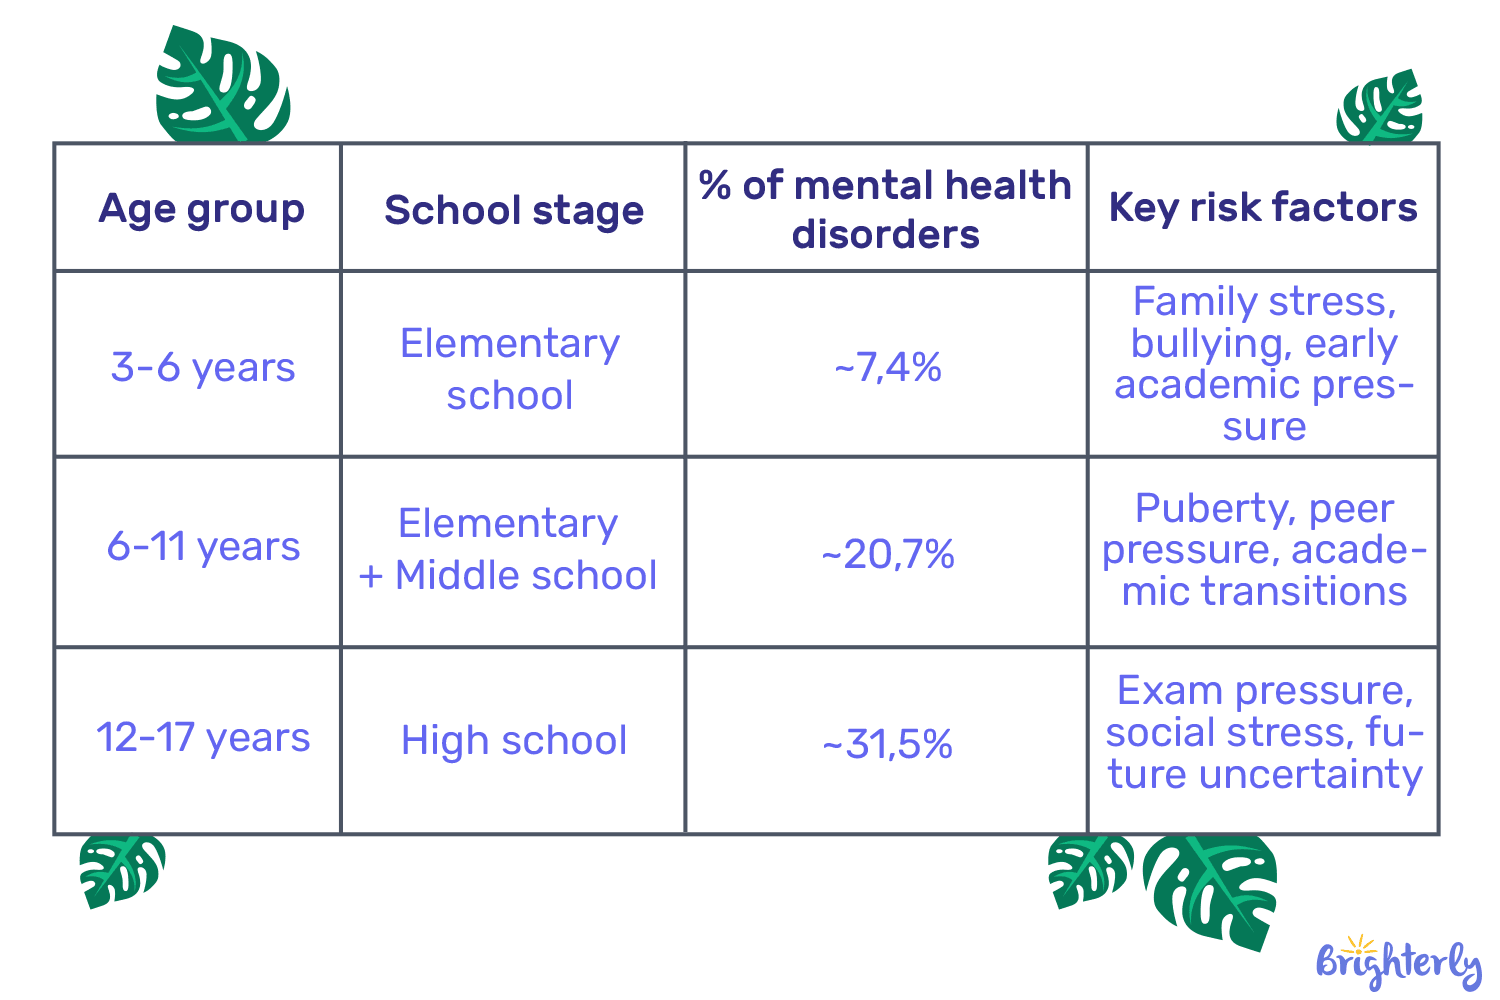
Mental health in schools statistics by age
Mental health issues can start early in life due to family problems, misunderstandings with peers, or personal setbacks. Usually, these disorders progress with age as children face more stressors. Below, I’ve provided a table from the CDC showing the middle school mental health statistics and explaining who faces mental health challenges at different ages, along with possible contributing factors.
Additionally, CDC data show even higher rates among teenage girls with an LGBTQ+ identity. They experience higher levels of traumatic stress, anxiety, sadness, and suicidal thoughts compared to other gender and their heterosexual peers.
What are the statistics for mental health in teens?
According to the large 2023 NSCH federal report, about 20.3% of teenagers aged 12-17 had a diagnosed mental or behavioral health issue:
16.1% anxiety disorder
8.4% depression
6.3% behavioral/conduct problems
There is also more recent data for 2024–2026, which focuses on college and university students. In short, student depression statistics:
18% reported depression
32% experienced symptoms of anxiety
11% had suicidal thoughts
Every second student reported feeling lonely
However, all these numbers are better than in 2022, showing a positive trend. Additionally, 36% of respondents in 2026 reported high levels of well-being.
What is the most common mental health problem in students?
According to the WHO, the most common mental health issue among students worldwide is anxiety, followed by depressive symptoms.
Why is anxiety so widespread among students? Teenagers face many new challenges, especially at school:
Academic pressure: Constant assessments, exams, and competition increase stress levels.
Impact of social media on student mental health: Active use of social networks can intensify fear of judgment and not meeting expectations.
Age and social changes: Adolescence and the transition to college come with emotional instability and uncertainty.
Uncertainty about the future: Choosing a career, education, and life path is a major source of anxiety.
How to help a teenager with mental health issues?
To help a teen with a mental health issue, you should provide a proper level of attention and open communication.
How can you help if you notice common problems?
Academic pressure and overload
Not all children can keep up with studying, social life, and hobbies at the same time. Help your child learn time-management skills, and consider letting go of some extracurricular activities to reduce their load. It’s also a good idea to talk with your child’s teachers to understand their performance and challenges, then calmly work together on how to improve things.
Family stressors
Problems at home can greatly affect a child. Review your family dynamics, try to resolve conflicts, and create a safe atmosphere at home. Make time for fun family evenings and avoid criticizing mistakes. Over time, your child will feel they can trust you.
Digital overload (high school mental health statistics)
Social media often encourages comparison, and there’s a risk of cyberbullying and information fatigue. You can read more about this in the article Statistics about social media and kids.
To help, psychologists recommend setting screen-free hours. I understand that taking away a teen’s phone isn’t realistic, but you can involve them in activities, hobbies, or family game nights – this works. Also, explain that not all images online are real, and not everyone on the internet is as successful or happy as they seem.
Stigma around mental health
Acknowledging a mental health issue isn’t easy. Kids may close off, fear judgment, and ignore the problem. Try to normalize conversations about mental health, its importance, and ways to improve it.
Note: If problems persist, seek professional help from a school counselor or a licensed specialist for assessment and treatment.
How can schools support student mental health?
Schools play an undeniable role in students’ mental health. Every year, new methods and programs are introduced to support students. Here are the 3-top approaches that lay the foundation for mental well-being:
School psychologists and counselors: In the U.S., about 18% of students use school mental health services! Over 70% of schools have at least one specialist who can help a child. According to depression in high school students statistics, this approach helps identify early warning signs and can support students effectively.
Social-emotional learning (SEL): Based on 22 studies, experts say programs that teach students to develop self-awareness and manage their emotions.
Reducing academic pressure: More than 60 studies show that high academic pressure causes stress, worsens well-being, and lowers motivation in children. If this negatively affects students’ lives, it’s worth rethinking teaching methods to ensure learning doesn’t harm their health.
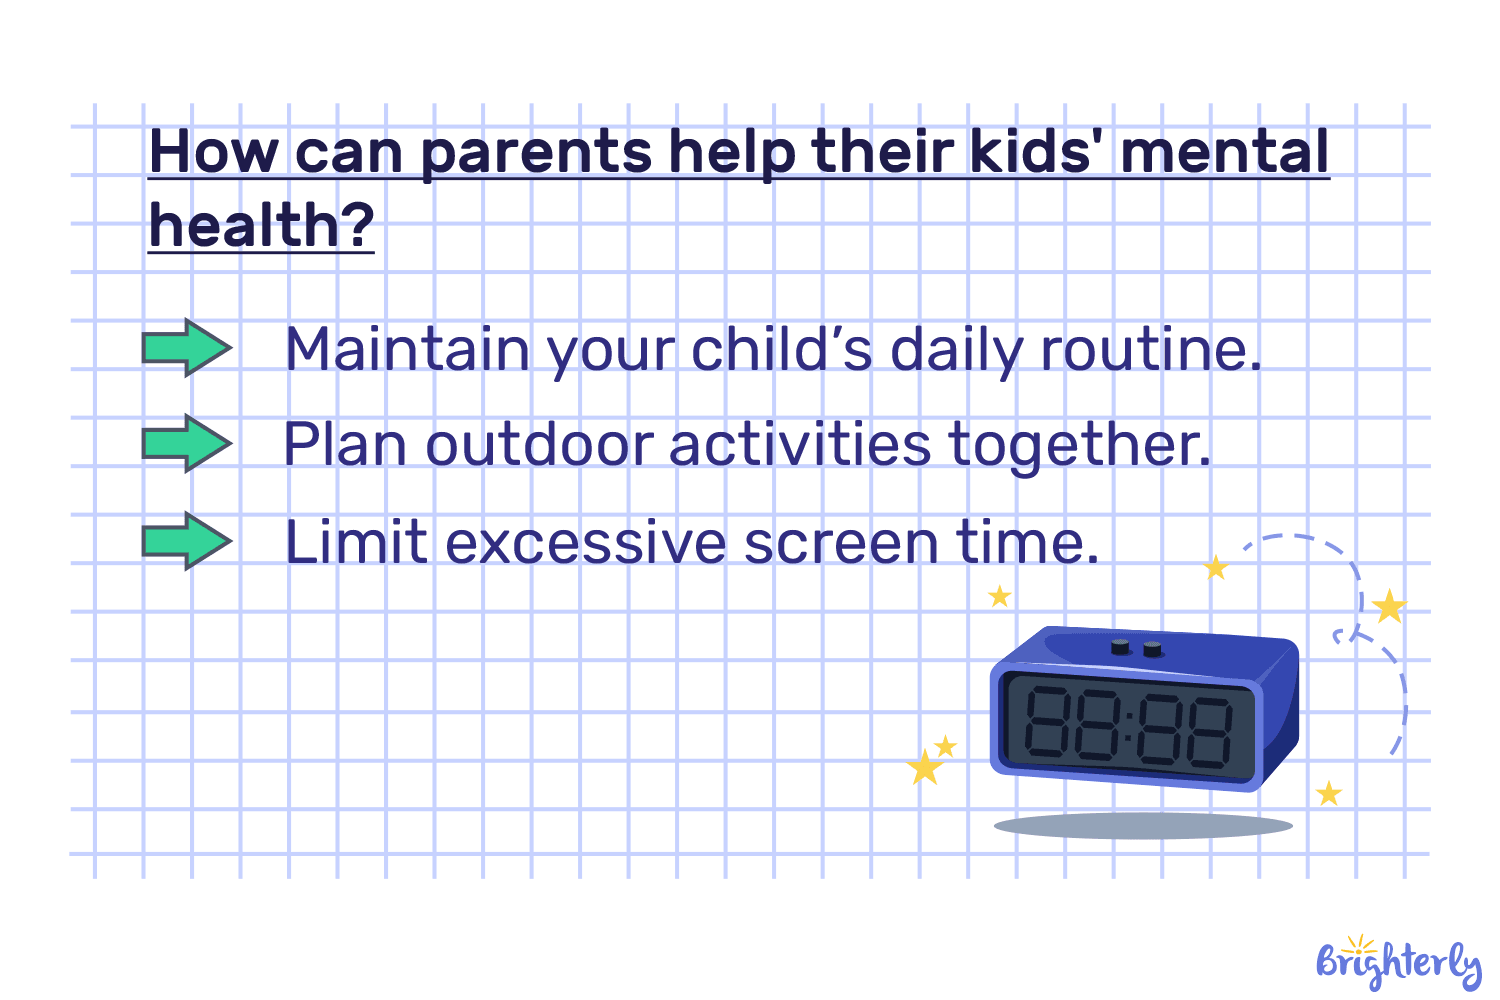
10 student mental health tips for parents
Maintain your child’s daily routine.
Plan outdoor activities together.
Limit excessive screen time.
Support healthy eating and encourage physical activity.
Be available for open, honest conversations.
To provide a non-judgmental space where teens can talk about their feelings.
Watch for changes in mood and behavior.
Encourage participation in a series of extracurricular activities.
Check on academic progress and offer help if needed.
Seek support from the school or professionals when necessary.
Mental health in students statistics: Conclusion
As you can see, statistics on teen mental health in recent years show that young people need mental health resources and support. Today, anxiety is the most common disorder among teenagers worldwide, and it is closely linked to academic stress, performance, and pressure.
At the same time, research confirms that both schools and you as parents can help your child overcome mental health challenges. Start by finding a safe learning environment for your child. If this isn’t available at school, consider additional platforms. My recommendation is the Brighterly math and reading platform. The company cares about its students, tailoring lesson pace, topics, and assignments to your child’s needs. They aim for your child to learn and enjoy, not feel stressed.
If you are looking for quality individual lessons for child in reading and math, you can book free lessonwith Brighterly to see if it’s right for your child.
Laila A. Lico began her teaching career over 12 years ago and has since developed a personal approach focused on making lessons enjoyable, meaningful, and relatable.
Many Americans anticipate making New Year’s resolutions to improve finances.
KEY FINDINGS:
48% are more stressed heading into 2026 than they were at the beginning of 2025
27% have decreased confidence in their ability to meet their retirement goals compared to last year
46% are likely to make and keep a resolution to manage money better or save more
MINNEAPOLIS – Dec. 16, 2025 – Nearly half of Americans say they are more stressed heading into 2026 than they were at the beginning of 2025, according to the 2026 New Year’s Resolutions Study* from the Allianz Center for the Future of Retirement, part of Allianz Life Insurance Company of North America (Allianz Life).
At the end of 2025, 48% say they are more stressed than they were at the start of the year. This is up from 43% last year.
Among Americans who say they are more stressed financially compared to last year, the top reasons include: costs of day-to-day expenses (54%), income is too low (46%), not saving enough for an emergency fund (39%), too much debt (35%), high health care costs (34%), and lack of job security (33%). Health care costs and lack of job security in particular rose significantly from last year.
With that sense of job insecurity, more Americans say they will start or continue looking for a new job in 2026 (56%, up from 47% last year). Still, many are planning to stay put and take part in “job hugging.” Seven in 10 (71%) who are not likely to look for a job say it’s because it seems safer to stay where they are in the current economic environment.
Financial stress hits retirement confidence
With that, 27% say they have decreased confidence in their ability to meet their retirement goals compared to last year. In particular, Gen X (38%) and Gen Z (32%) are more likely than millennials (24%) or boomers (20%) to say they have decreased confidence compared to last year. What’s more, many Americans don’t feel like they are making progress toward retirement. About one in five (21%) say they are further from reaching their retirement goals than they were a year ago.
“When feeling financially stressed, long-term goals like retirement can be the easiest to sideline because you don’t feel it in your day-to-day life,” says Kelly LaVigne, VP of consumer insights, Allianz Life. “But achieving long-term financial security takes time and you may be better off consistently working toward retirement incrementally than trying to wait until you can devote a larger part of your budget to the goal.”
Americans struggle with financial discipline
The majority of Gen Z (56%) and millennials (63%) say they are likely to make and keep a resolution in 2026 to manage money better or save more. Less than half of Gen X (43%) and boomers (23%) said the same. Overall, 46% of Americans say they were likely to make and keep a resolution to manage money better or save more. This was the second most popular resolution after exercise and diet.
Many Americans say they established good financial habits in 2025. More than one in three (34%) say they reduced their spending.
Still, Americans say their worst financial habits are spending too much money on things they don’t need (32%), not saving as much as they could (25%), not saving any money (23%), and not paying down debt fast enough (22%). Gen Z was more likely than other generations to say they spend too much on things they don’t need (50%) and don’t save any money (32%).
“At every stage of life, it can be important to consider a written financial strategy so that you document your financial goals,” LaVigne says. “Without a documented strategy for your finances, it can be tempting to spend now instead of saving for later. If you know why you are saving and what goals you are working toward, making those decisions can be simpler.”
*Allianz Center for the Future of Retirement conducted an online survey, the 2026 New Year’s Resolutions Study in November 2025 with a nationally representative sample of 1,038 respondents age 18+ in the contiguous U.S.
The Allianz Center for the Future for Retirement produces insights and research as a part of Allianz Life Insurance Company of North America.
Allianz Life Insurance Company of North America does not provide financial planning services.
Brother Hatchel doesn’t see so well anymore. And he has a prosthetic leg. So brothers Navy and Klugh guide him along the outdoor railing of the historic school where their fraternity chapter meets.
Using two canes, Hatchel, 74, who is wearing his black-and-gold Alpha Phi Alpha ball cap, maneuvers down the walkway, with Navy, 76, and Klugh, 74, guiding him: Turn right, careful, watch your step.
The three Silver Spring men have been “brothers” most of their lives — members of the same elite black fraternity as the Rev. Martin Luther King Jr. And as they anticipated the dedication of the $120 million King memorial , they were proud to point out that the idea was born in a modest brick rambler on East-West Highway.
Thursday night, officials announced that because of Hurricane Irene, the dedication of the memorial will take place not on Sunday as expected, but in September or October.
On Feb. 4, 1968, Dr. Martin Luther King Jr. delivered a sermon titled “The Drum Major Instinct.” King encouraged his audience to seek greatness, but to do so through service and love.
Students represented different civil rights advocates who practiced nonviolent protests at the MLK Breakfast Celebration, an annual event that honors Dr. Martin Luther King Jr. and his accomplishments.
“… It means that everybody can be great. Because everybody can serve,” King said in his speech. “You don’t have to make your subject and your verb agree to serve. You don’t have to know about Plato and Aristotle to serve. You don’t have to know the second theory of thermodynamics in physics to serve. You only need a heart full of grace. A soul generated by love. And you can be that servant.”
To bring the speech to life and to celebrate the civil rights leader’s birthday, UT Dallas students created a program involving dance, song and video at the University’s annual Martin Luther King Jr. Celebration Breakfast.
To begin the program, graduate student Mito Are performed an a cappella version of “Amazing Grace.” As students, faculty and staff started breakfast, video clips from the civil rights movement were projected onto a number of screens, and King’s voice echoed around them, bringing the audience into the 1960s.
Members of the Student Voices from UTD performed an interpretive dance to the song “A Change is Gonna Come,” by Sam Cooke. A trio of dancers moved in harmony to lyrics such as “there been times that I thought I couldn’t last for long, but now I think I’m able to carry on.”
Students Zeeshan Moosa (right) and Darrel “Friidom” Dunn performed a dance to Sam Cooke’s “A Change is Gonna Come.”
In the spirit of King’s belief in nonviolent protest, students also carried large posters with portraits of other “Drum Majors for Justice,” which included Stevie Wonder, Harvey Milk, Malala Yousafzai, Pope Francis, Anne Braden, Nelson Mandela, and the three civil rights activists who were killed in Mississippi in 1964 — Andrew Goodman, Michael Schwerner and James Earl Chaney.
The program was written and directed by arts and humanities PhD candidate Vanessa Baker.
“I approached the concept of the production from my extensive research on Martin Luther King Jr., the movement, and King’s vision for community, equality and justice,” Baker said. “The concept for the breakfast aimed to convey that vision. It aimed to pay tribute to the enormous contributions that King made, which ultimately benefited all of humanity, and to give thanks to the hearers of his message — to those who took and continue to take up the baton for change.”
Martin Luther King Jr. Day is observed on the third Monday of January each year, near King’s birthday on Jan. 15. President Ronald Reagan signed a bill creating the federal holiday to honor King in 1983. It was observed for the first time on Jan. 20, 1986.
Media Contact: The Office of Communications and Marketing, or the Office of Media Relations, UT Dallas, (972) 883-2155, newscenter@utdallas.edu.Tagged:A&H
Location: Silver Spring Civic Building at Veterans Plaza
The Montgomery County Volunteer Center has partnered with the Montgomery County Alumnae Chapter (MD) of Delta Sigma Theta Sorority, Inc. to host this year’s event at the Silver Spring Civic Building at Veterans Plaza on Monday, January 19, 2026, Participate in service projects that will benefit people and communities in Montgomery County. Participants will also have the chance to engage with local non-profit organizations to learn about opportunities to give back throughout the year.
Registration required. Please note, if you have previously reserved your spot for this event through Eventbrite, you do not need to register again. Your spot has been reserved.